Dashboard
info
After logging into TestMore, the Dashboard page will be the first thing you see. On the Dashboard page, users can view a summary of the organisation's data they are affiliated.
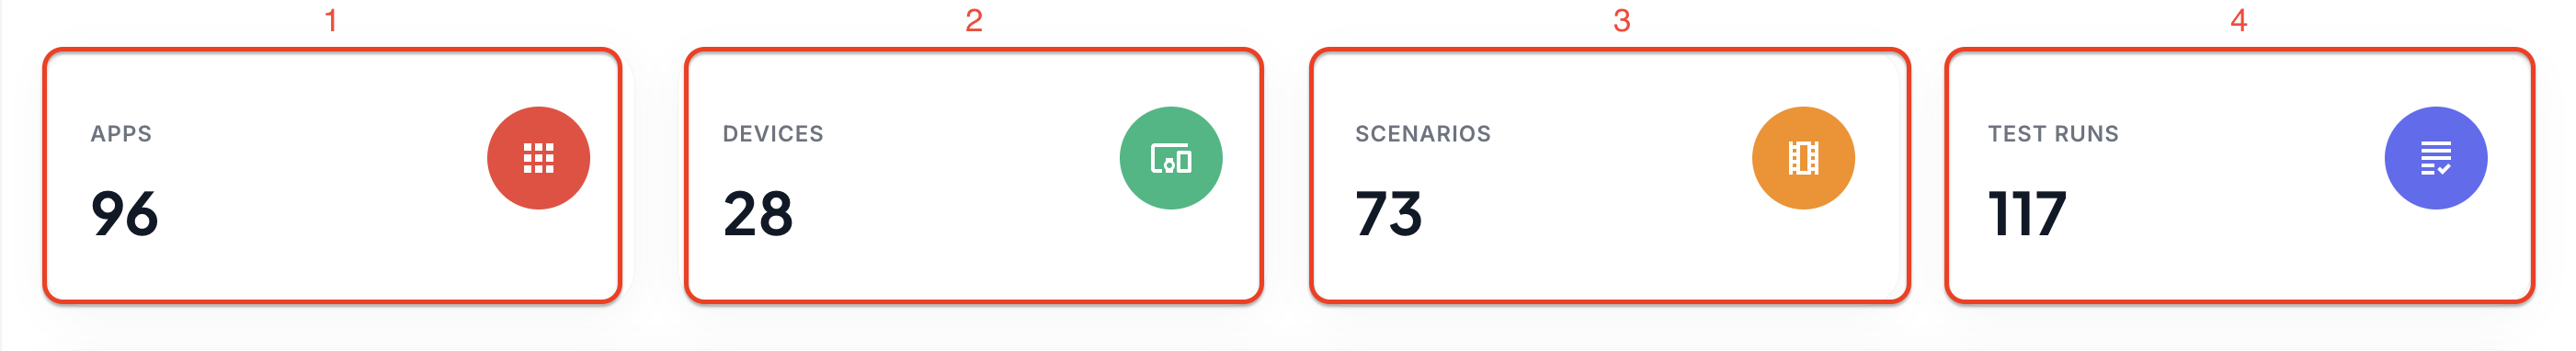
- Apps: The number of apps uploaded to the organization the user is in is displayed in the Apps widget.
- Devices: The number of connected devices is displayed in the Devices widget.
- Scenarios: The number of test scenarios that have been created in the organization is displayed in the Scenarios widget.
- Test Runs: The number of test runs during the process is displayed in the Test Run widget.
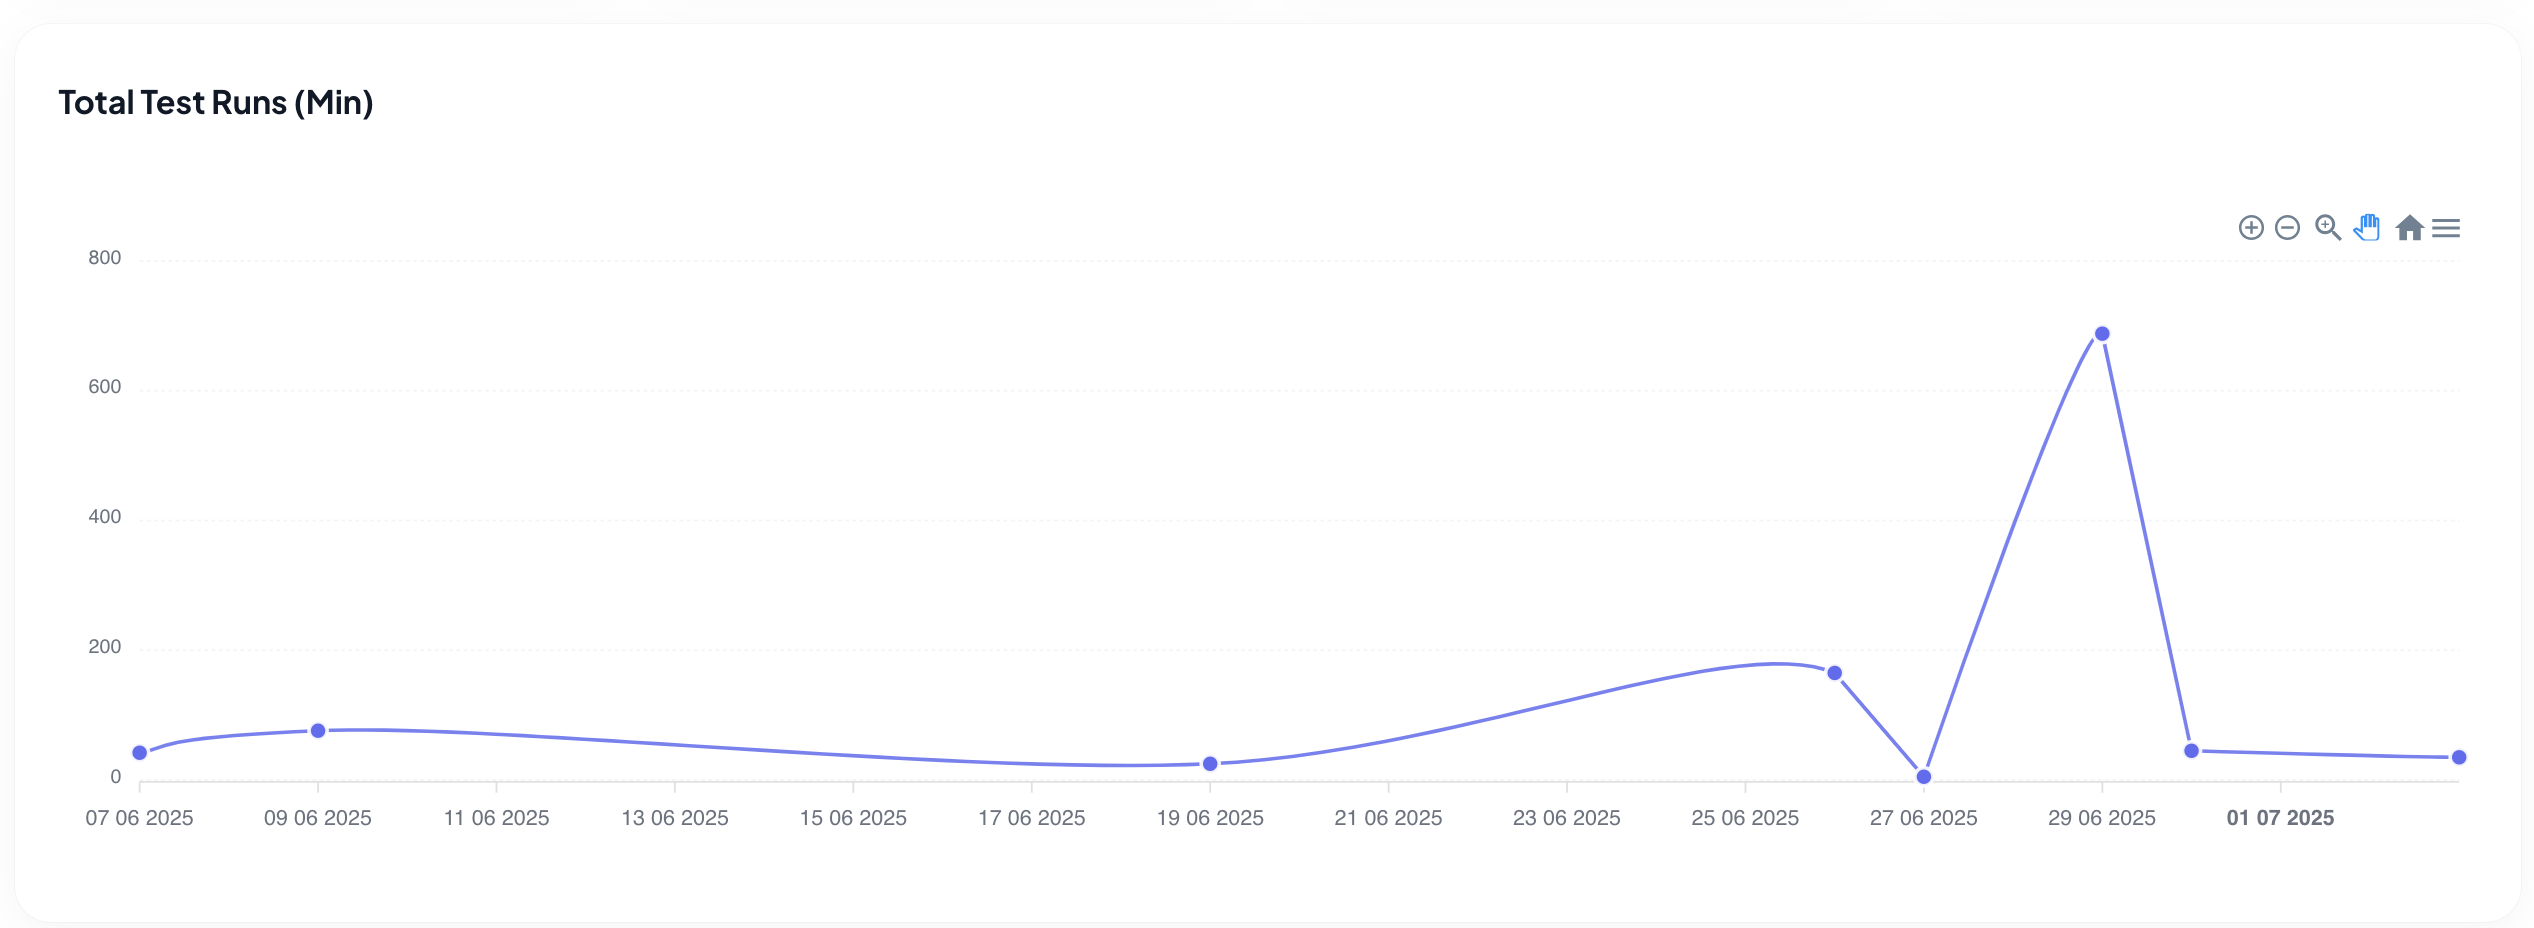
- Total Test Runs: This graph shows how many minutes of running were done on which day in the current month.
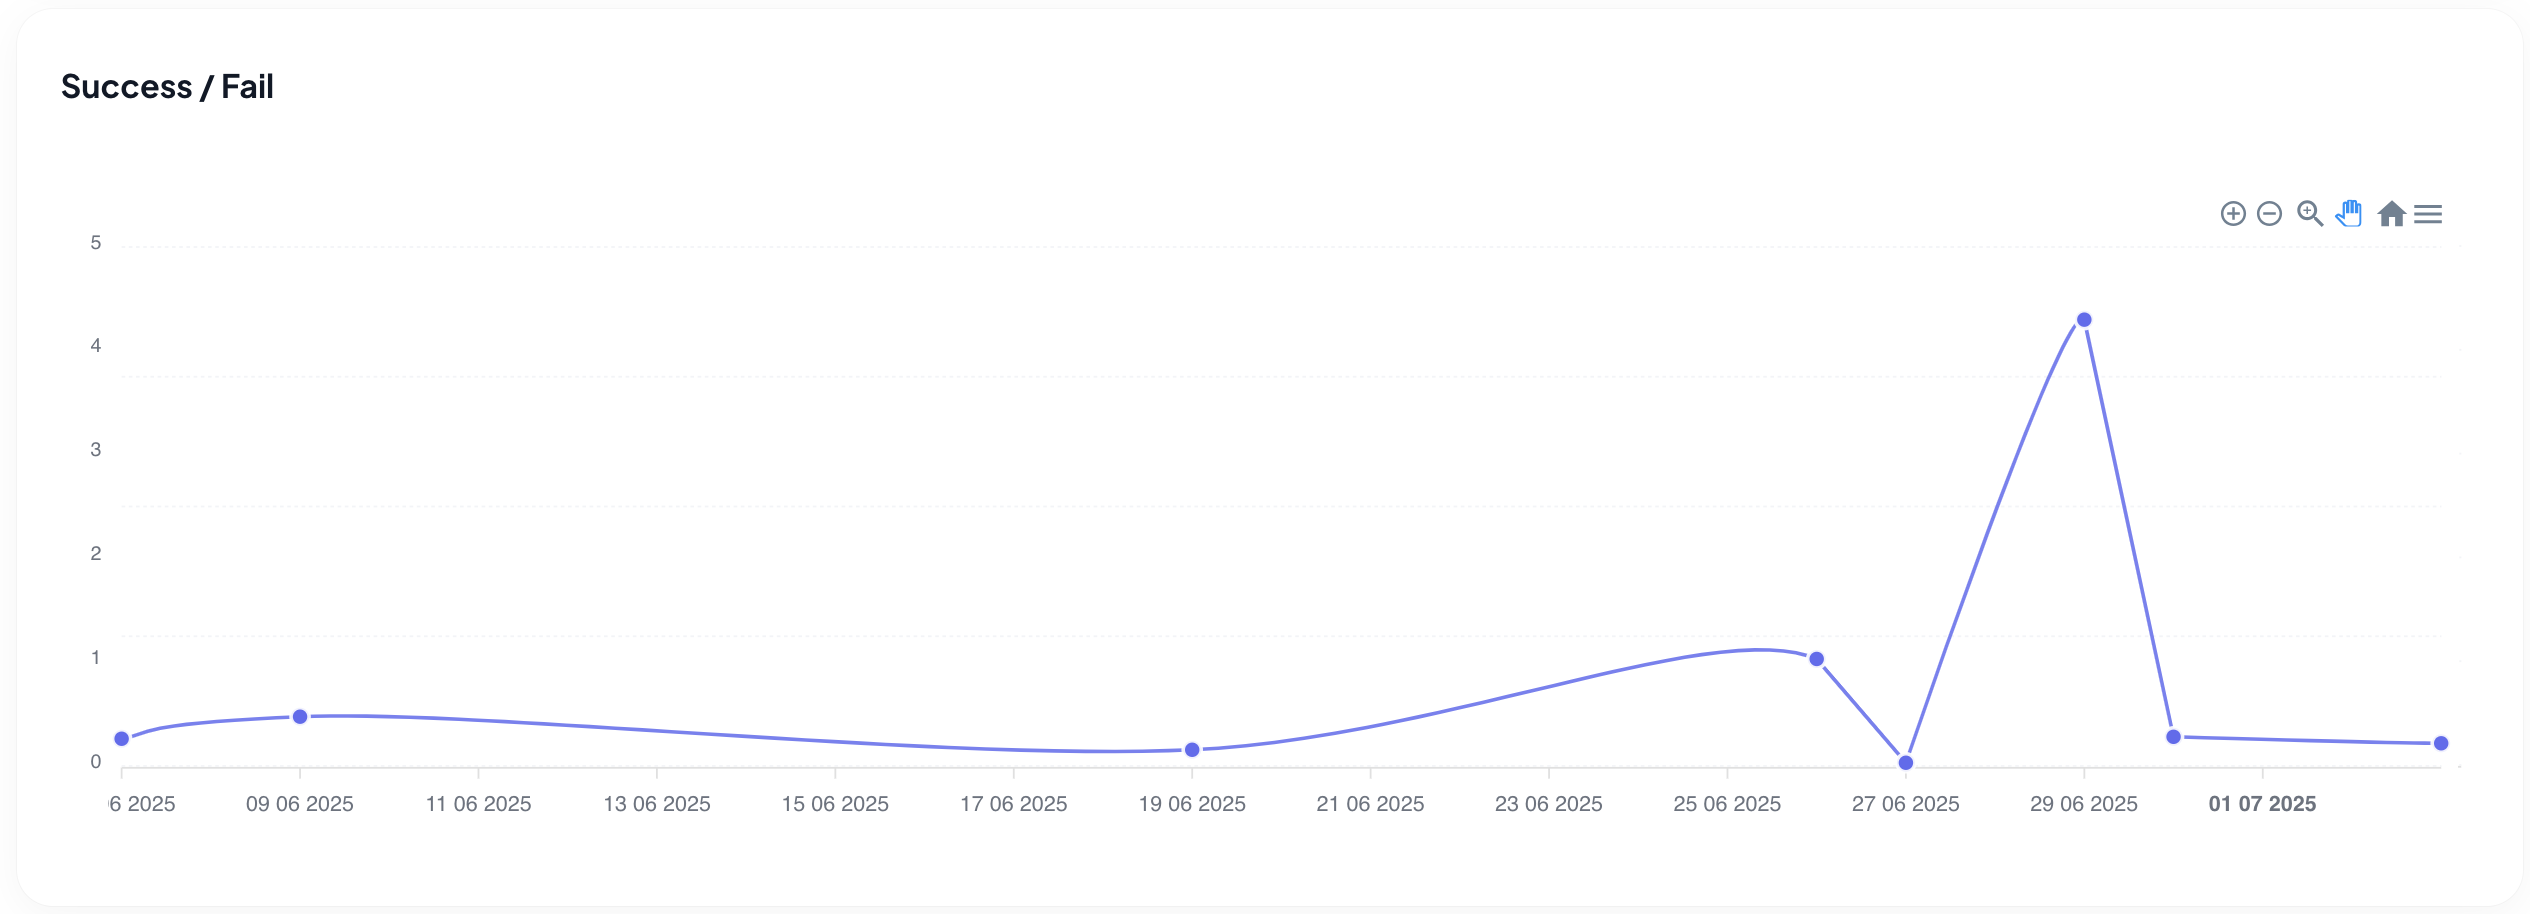
- Success/Fail: This graph shows the success/fail rate in test runs.